Advantages of Optimizing for Ad Strength in Google Ads: What We Learned from Large B2B SEM Campaigns

Julia Muller
Associate Director, Search
Contributors: Sarah Rogers, Search Associate and Donald Trey Norman, Digital Media Associate
An average eight-figure Google Ads account that we onboard at Just Global has 26% of spend and 16% of conversions generated by the ads that are ranked ‘poor’ by the Google Ads system.
Over the course of seven months following Responsive Search Ads (RSAs) becoming the only acceptable format in Google Ads in July of 2022 (and in Microsoft Ads starting in February of 2023), most large advertisers have been slow to create enough headlines and descriptions to run the majority of their ads at an acceptable ad strength.
Just Global’s Paid Search team set out to upgrade clients’ ads from ‘poor’ to ‘excellent’ ratings. Today we publish the first 11 weeks of results from the effort.
But first, why should we care about Responsive Search Ads' strength?
If we run low-quality keywords with an acceptable cost per conversion, what is the argument against running some ‘poor’ ad strength? According to Google’s product team, the argument is in the upside potential of improving performance, which we tested.
Improving RSAs in bulk: cost factors and other considerations
As we worked to improve ad strength, we acquired the Google product team’s insight, consulted RSA best practices, and spared no effort sifting through manual in-platform recommendations iterating ad copy until we reached ‘excellent’ ad strength. The process also involved a few rounds of ad copy review and approval by clients.
The timing of our effort pre-dated ChatGPT, we did not use ChatGPT to create any text. 🙂
The number of hours spent on finding ways to improve the ads is a cost factor we had to keep in mind. As we tested various headlines and descriptions manually to achieve “excellent” ad strength in-platform, we stayed within one region for scalability even though our campaigns are running worldwide. In the end, the majority of the resulting RSAs were ranked ‘excellent’ by Google Ads UI in the tested region. A small fraction of the resulting ads were ranked ‘good’ (2nd best after excellent) due to the advertiser’s inability to match certain niche keyword relevance or to un-pin headlines.
Upon launch, we duplicated those predominantly ‘excellent’ ads worldwide and noted that identical RSA ads could be ranked two or even three different strengths depending on the region.
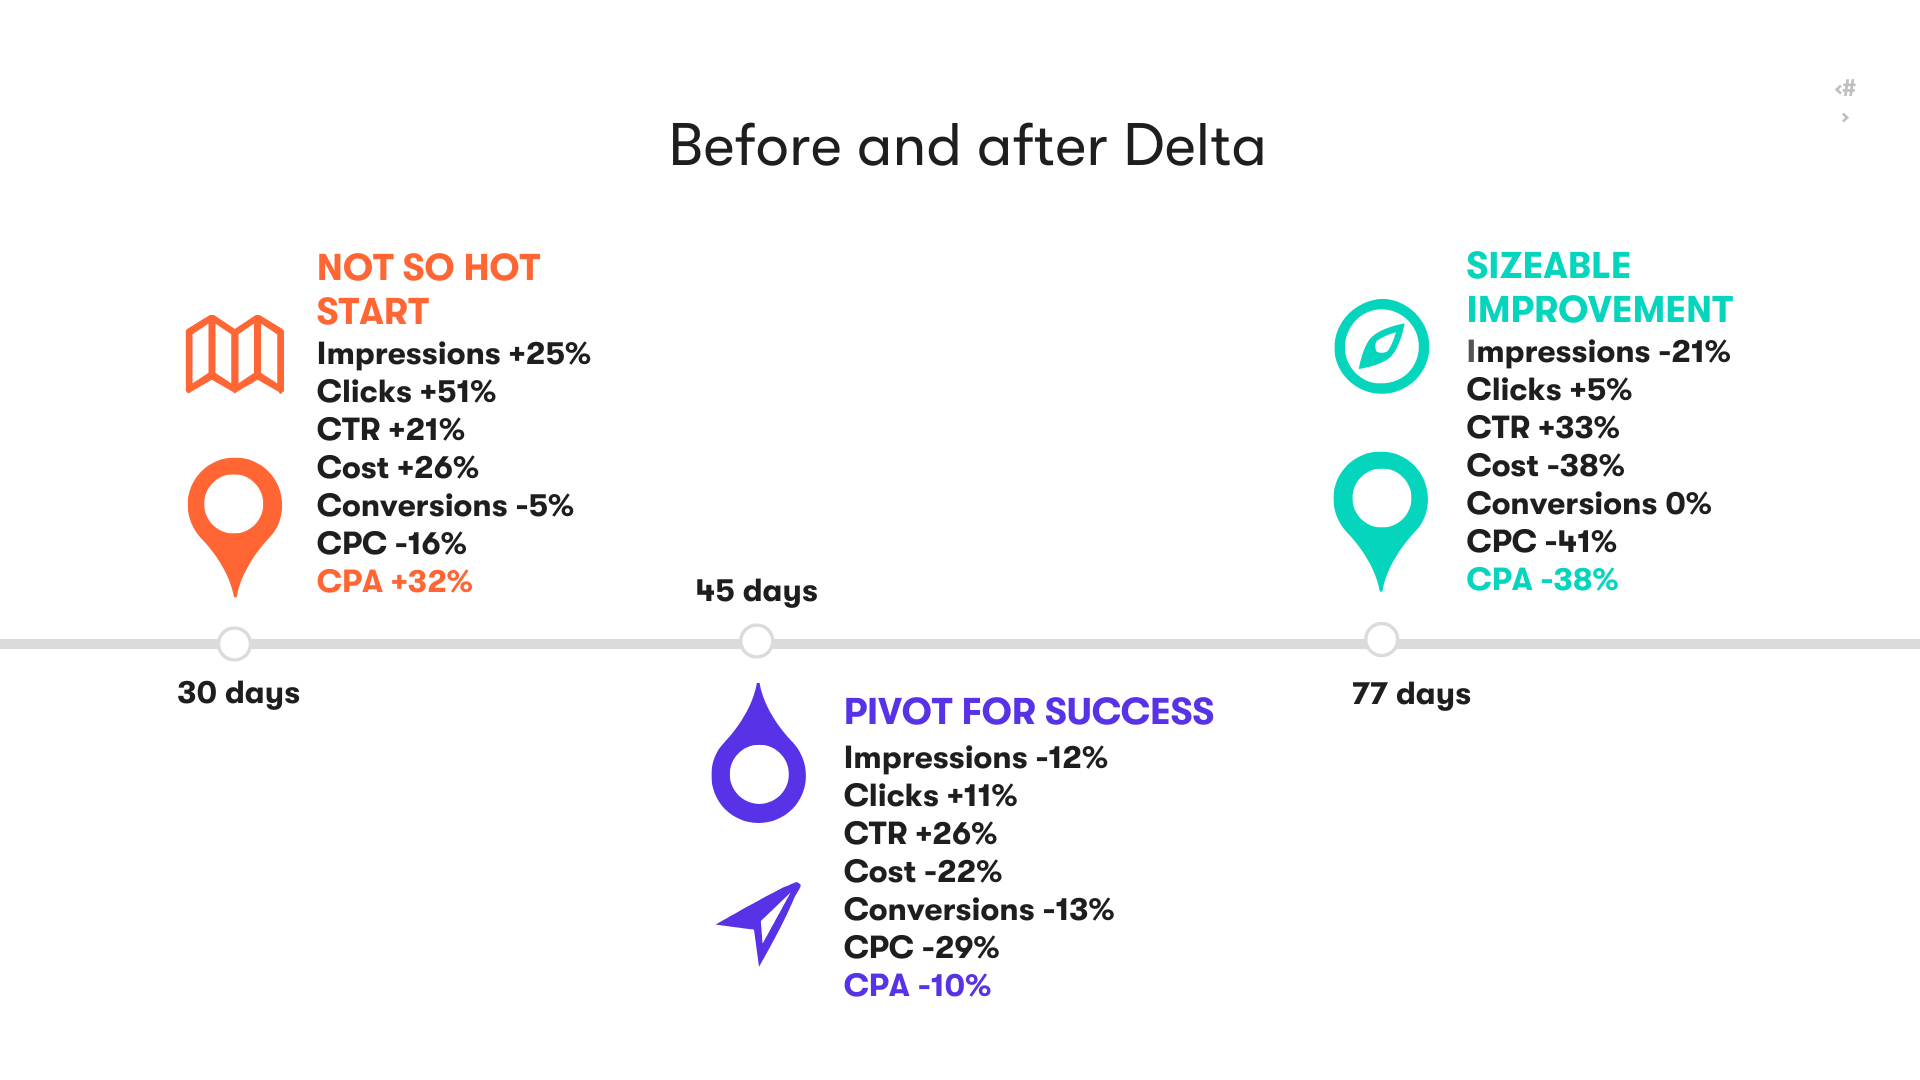
30-, 60-, 77-day updates: high-level summary
In the first month upon launch performance dipped: although the volume of impressions and clicks went up, CPA shot up 32%, and cost was also up 26%. Then, 45 days after the upgrade things turned for the better: the new ads generated a 10% Cost Per Acquisition improvement on top of a 22% spend reduction as compared to the ads we replaced, but the volume of conversions was still lower by 5%. Currently, 11 weeks later, our conversion volume restored completely, while CPA performance improved by 38%, with 38% less spend when compared to the ‘poor’ ads’ performance over 11 weeks before the upgrade.
Also, while most ‘poor’ ads were replaced with the ‘excellent’ ones, in the end, impressions, clicks, spend, and conversions largely came from the (much) smaller fraction of the ‘good’ ads. Our findings confirm Google’s claim of more clicks and ultimately conversions, as we achieved more clicks and improved cost per acquisition by 38% 11 weeks later. Details below.
‘Before and after’ results
As we evaluate the impact of optimizing for ad strength, we must first acknowledge that we are unable to run a clean A/B test comparing ‘poor’ and the improved ads in-market side by side. So, we are using the next best approach – the ‘before and after’ comparison.
Comparing the ‘before’ and ‘after’ time frames can be tricky if one includes stronger intent and the other runs over major holidays for example helping or hurting one period’s performance over the other. In this case, we found our ‘before’ and ‘after’ periods are comparable as they both include traditionally slow B2B advertising times.
When it comes to getting more clicks with higher ad strength – a claim put forward by the Google product team, we can confirm that we did get an increase in clicks. However, we did not see the corresponding increase in conversions until a month and a half after launch, when the volume of conversions restored with 18% less spend, thus increasing the ROI per dollar invested. Here are the results:
In summary, we conclude that the effort to replace ‘poor’ ads was ROI-positive and continue to upgrade all our clients’/advertisers’ SEM accounts for the best possible ad strength.
Why did ad strength improvements work? We believe that ad strength was a factor in allowing more ad auctions while paying less and achieving a higher position on the page. Our clients didn’t change their features or offered a promotion, nor did their budgets or keywords change. Their ads were simply able to better qualify for the previously hard or impossible-to-get-in ad auctions and advertisers paid less per click on the ads. We recommend optimizing for ad strength in B2B marketing efforts.
Study setup
New RSAs were duplicated globally across 170+ countries in English language campaigns. Upon launch the system re-ranked our mostly ‘excellent’ in test region ads to 60% ‘excellent’ across all regions, 25% received ‘good’ strength, and 5% were deemed ‘average.’
Per Google’s best practices, an ‘average’ RSA strength is not good enough and should not be used. However, the percentage of ‘average’ ads was small in our case, so we decided to go live, knowing that those few ‘average’ ads will be refreshed during the next round of optimization.
New ads launched on November 29th, 2022, thus running through winter holidays across the globe over a month and a half are tracked on the charts below.
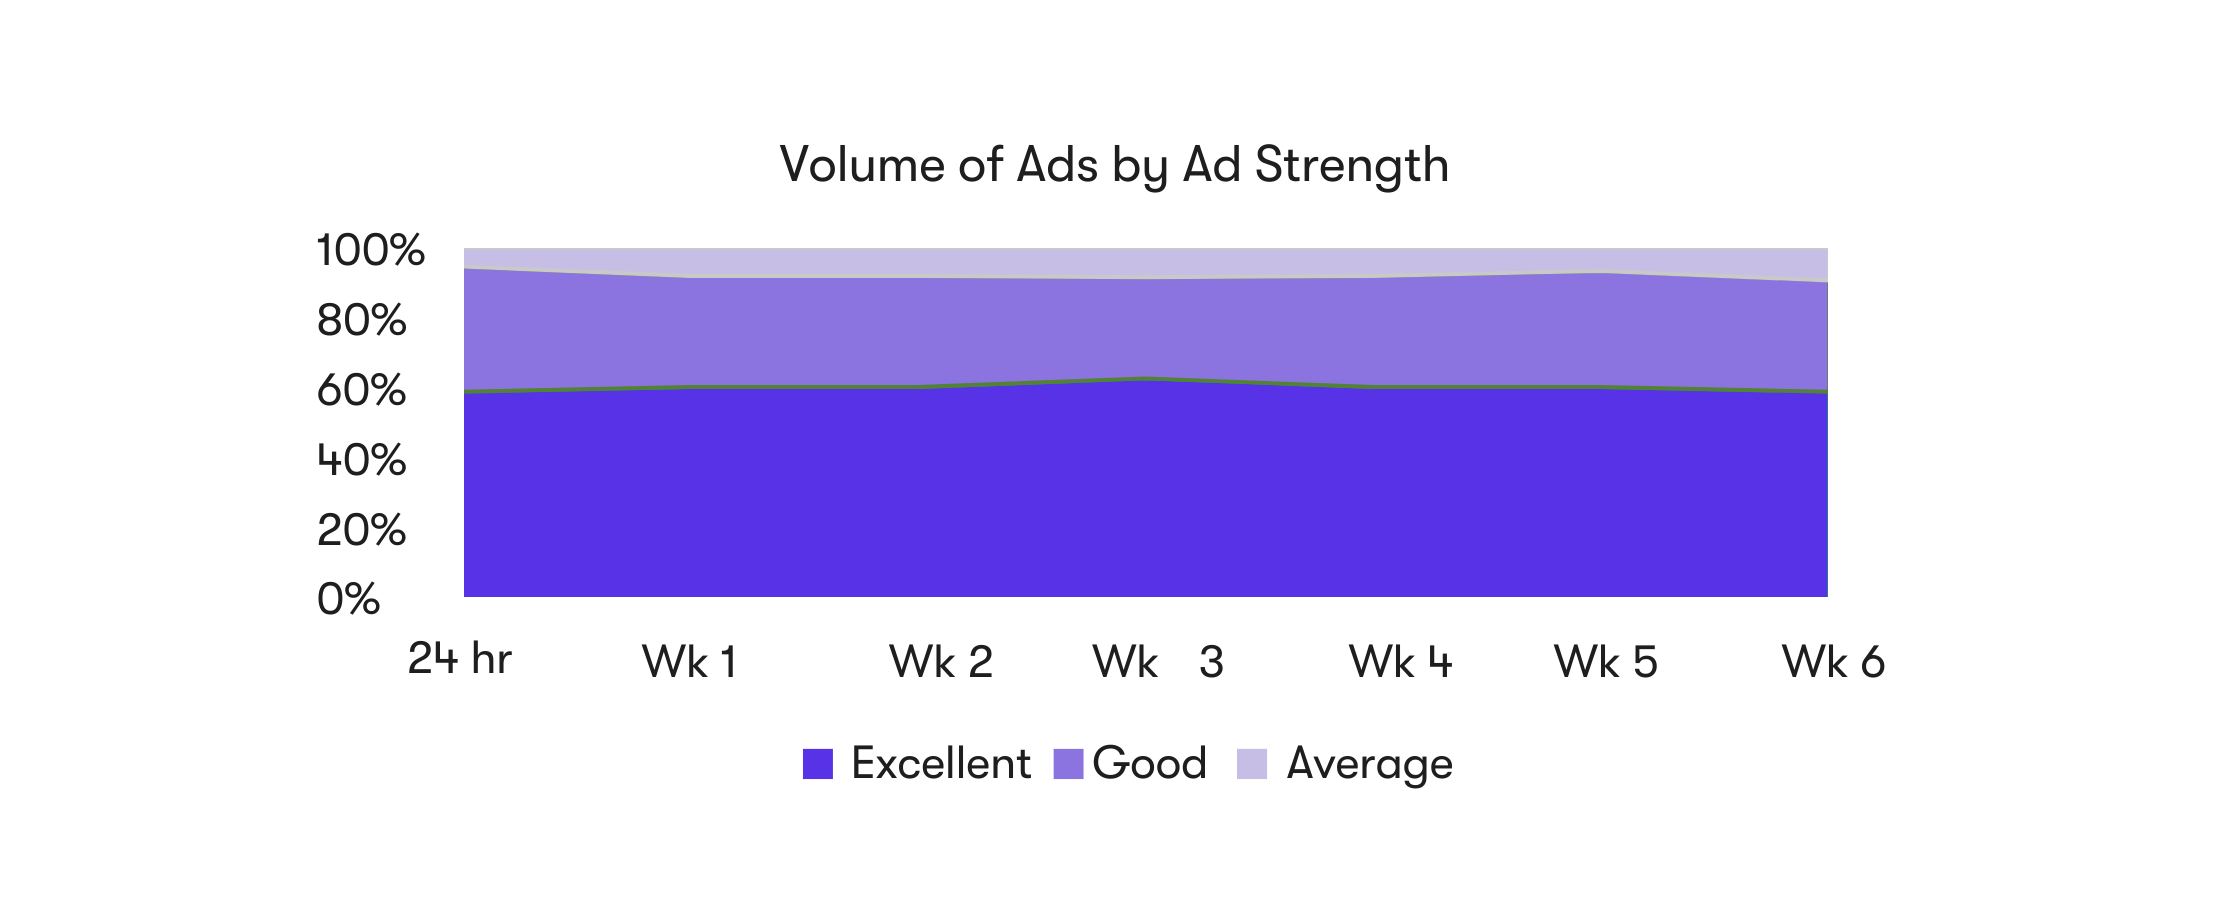
Performance by ad strength tracked weekly over the period of 6 weeks:
From launch, ad strength changed very little. The new ads ranked 60% ‘Excellent’ / 35-30% ‘Good’ / 5-10% ‘Average.’ This confirms we did accomplish what we set out to do: replace ‘poor’ ad strength with (mostly) ‘excellent.’.
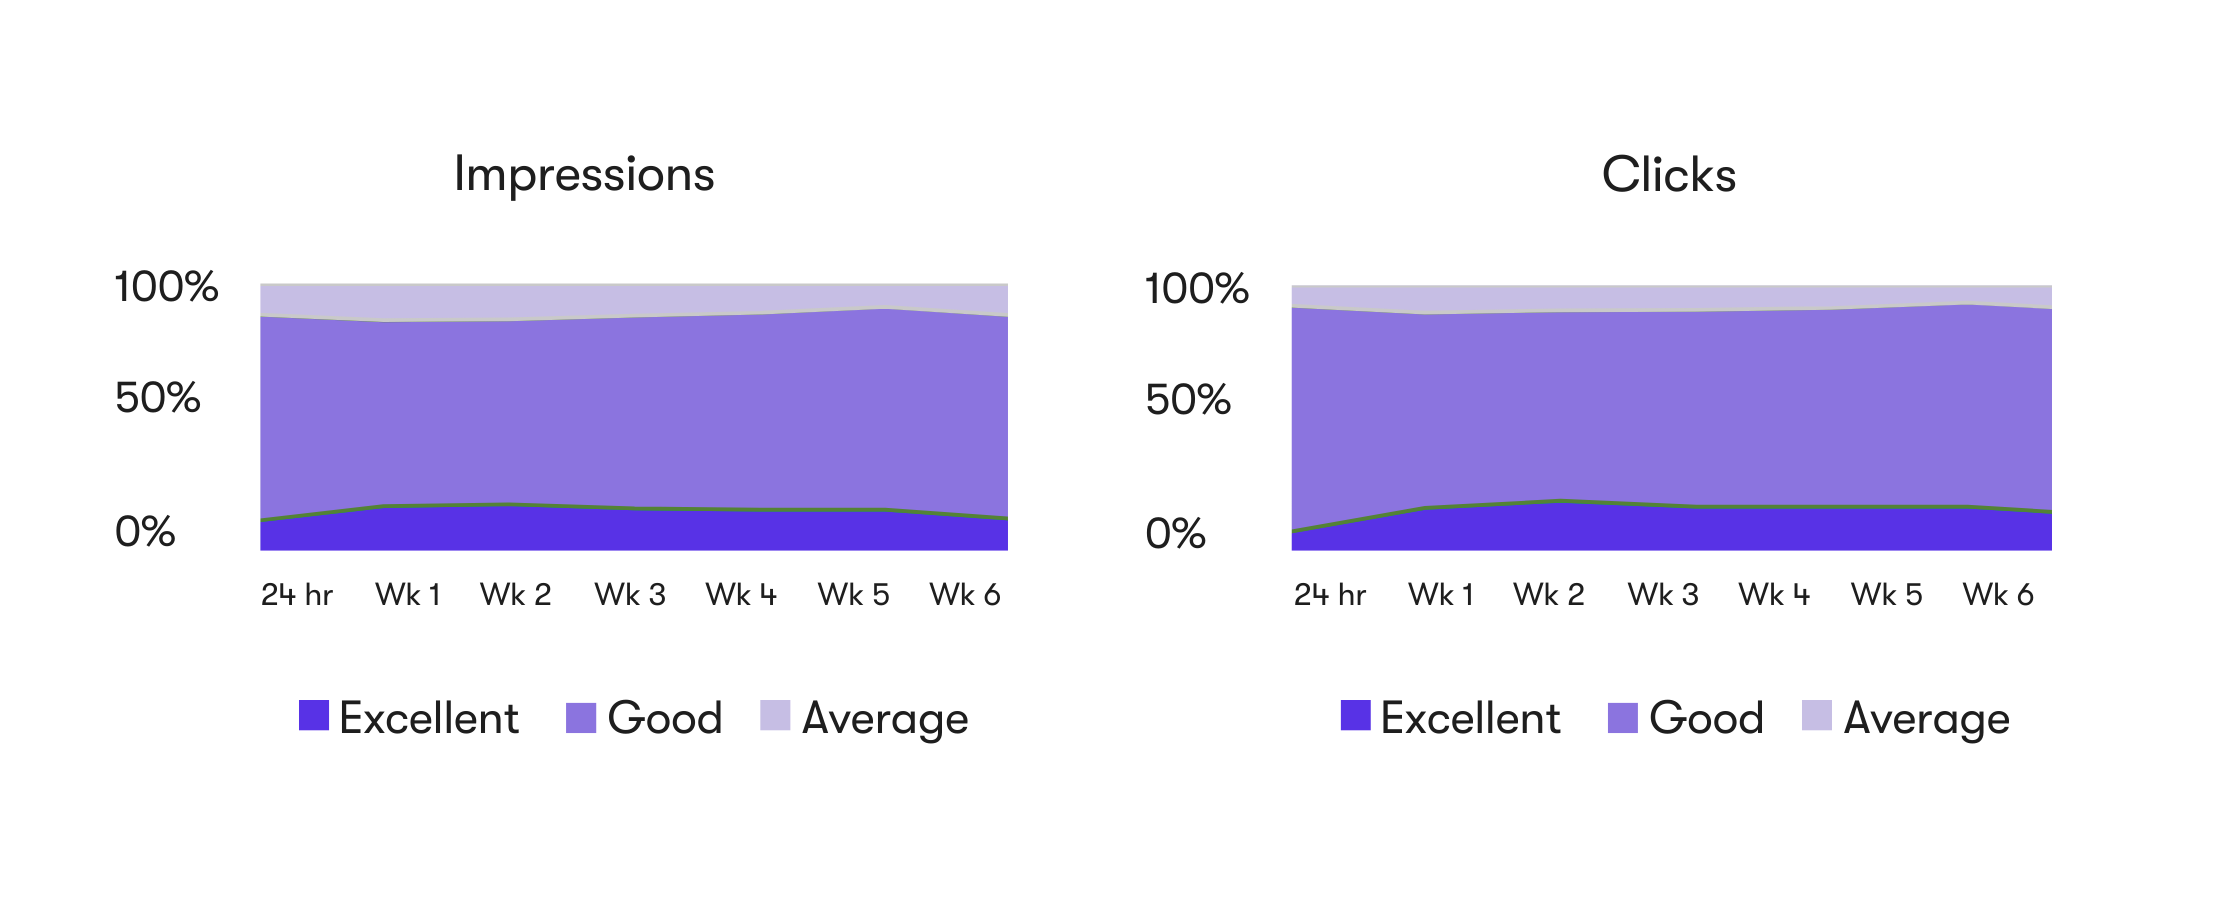
With most ads ranked ‘excellent’ we expected they would drive the most performance, but that was not the case. Up to 76% of impressions and 84% of clicks went to the ‘good’ strength ads. ‘Excellent’ ads generated up to 20% of impressions and clicks. ‘Average’ ads captured up to 13% impressions and 10% clicks. As shown below:
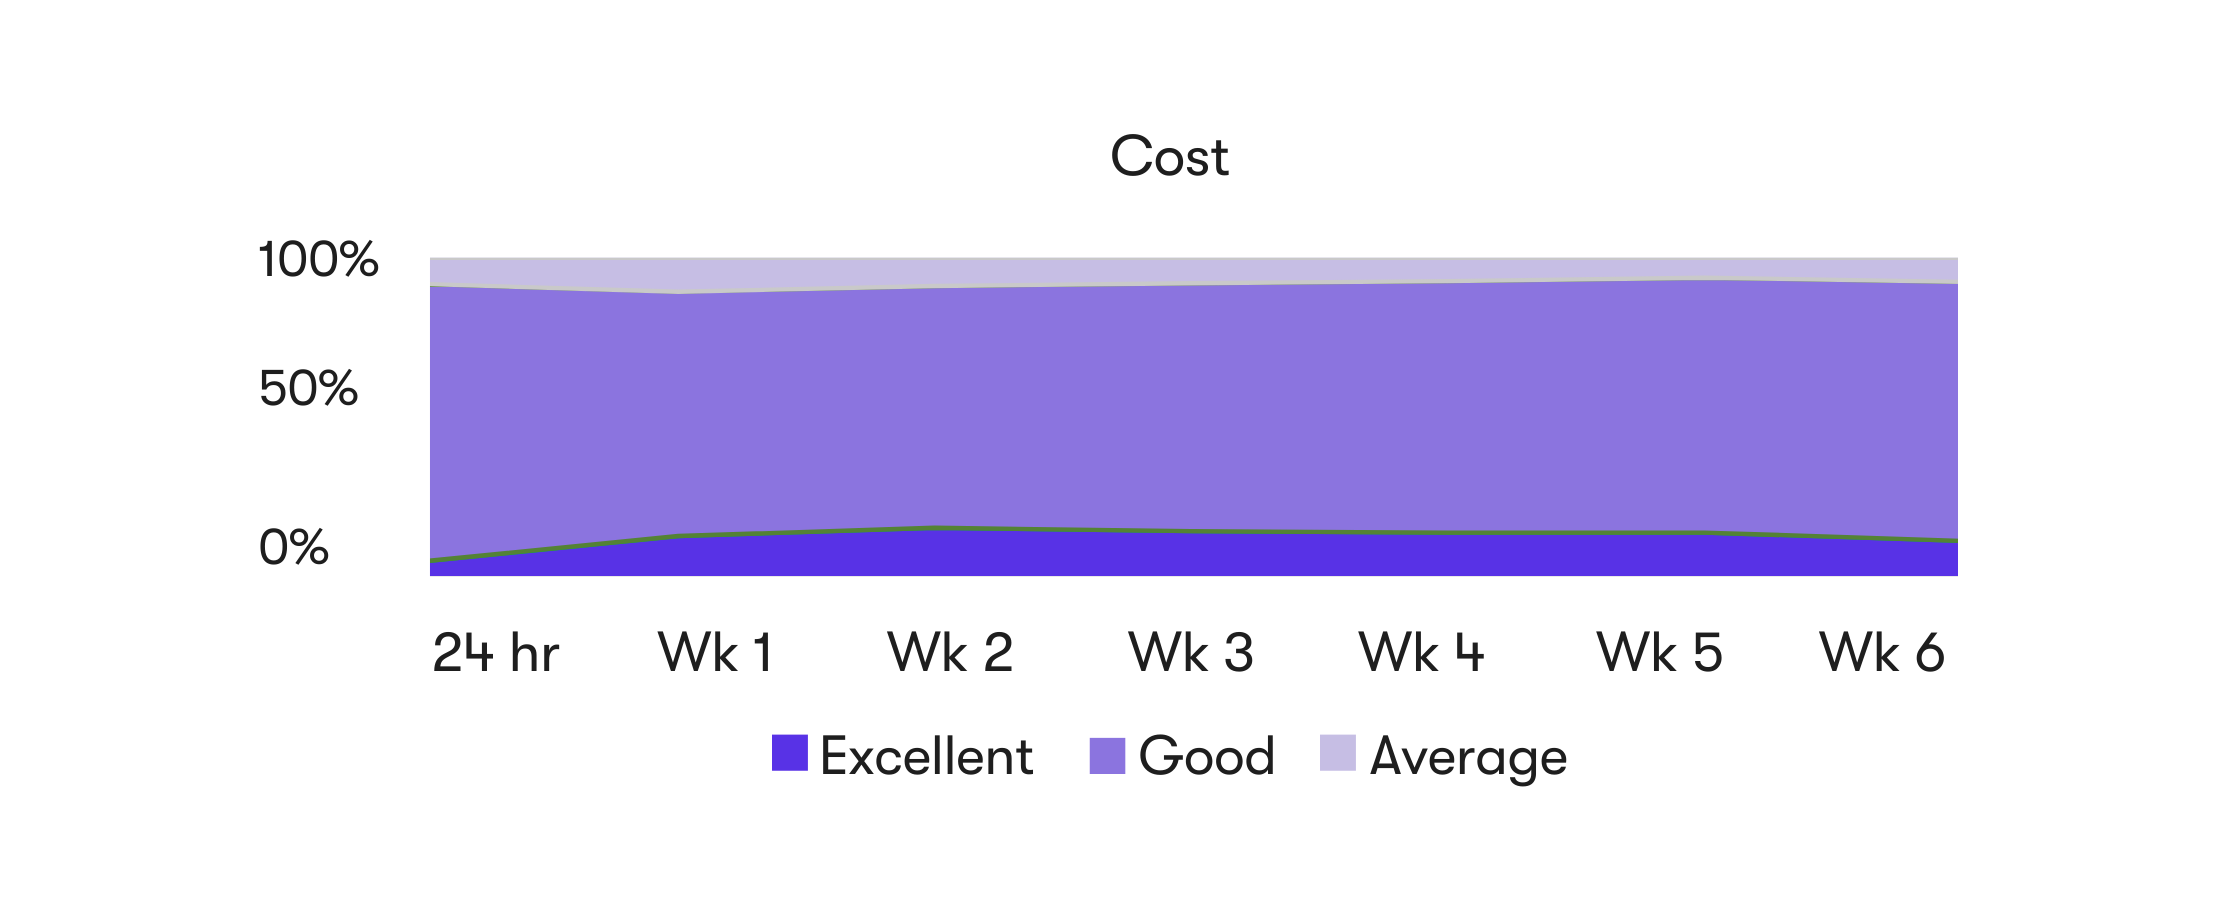
Same for cost, up to 81% was spent by the ‘good’ strength ads. And up to 16% of the cost was spent by the ‘excellent’ ads, while up to 11% went towards ‘average’ ads. In the end, while we replaced most ‘poor’ ads with ‘excellent,’ impressions, clicks, and spend largely went towards the ‘good’ strength ads.
Did ad strength fluctuate or decline after launch?
We observed that once ranked ‘excellent,’ ‘good,’ or ‘average’ ads held their strength rankings almost steady.
Let’s look at cost per click
Cost Per Click is still a leading indicator of performance even in the modern times of running predominantly on smart bidding in Google Ads. In terms of CPC, our updated RSAs across the board outperformed the account average $4.29 CPC by 26%. Not only did the new ads outperform the account average, but they continuously became more and more affordable as time went on, especially the ‘excellent’ ones, as illustrated on the chart below:
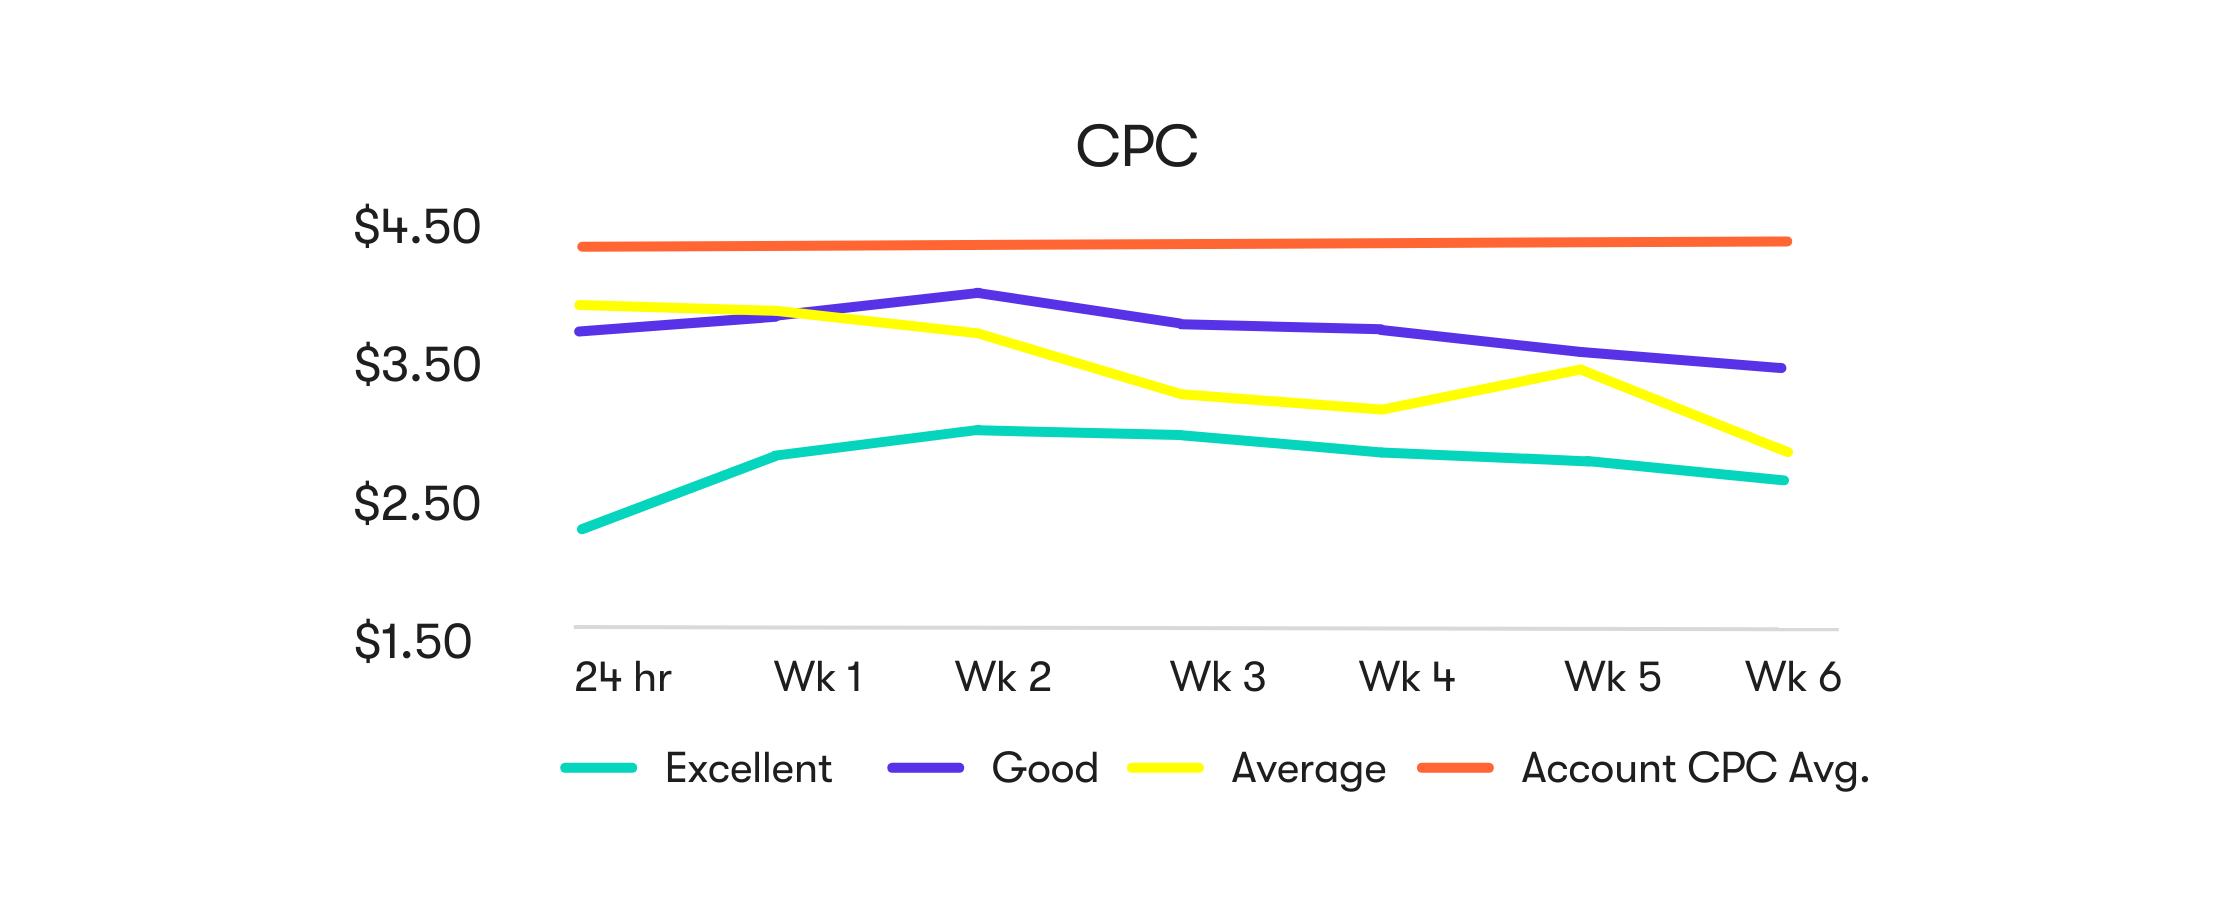
Based on the CPC, new ads’ strength outperformed the account average $4.25 CPC by 30-50%.
Conversion distribution by ad strength
Conversion distribution was different from all other metrics: 47% to 64% of all conversions came from the ‘good’ strength ads on any given week. 17% to 26% of conversions came from the ‘excellent’ strength ads, leaving 12% – 33% to the ‘average’ ones. As the graph below shows:
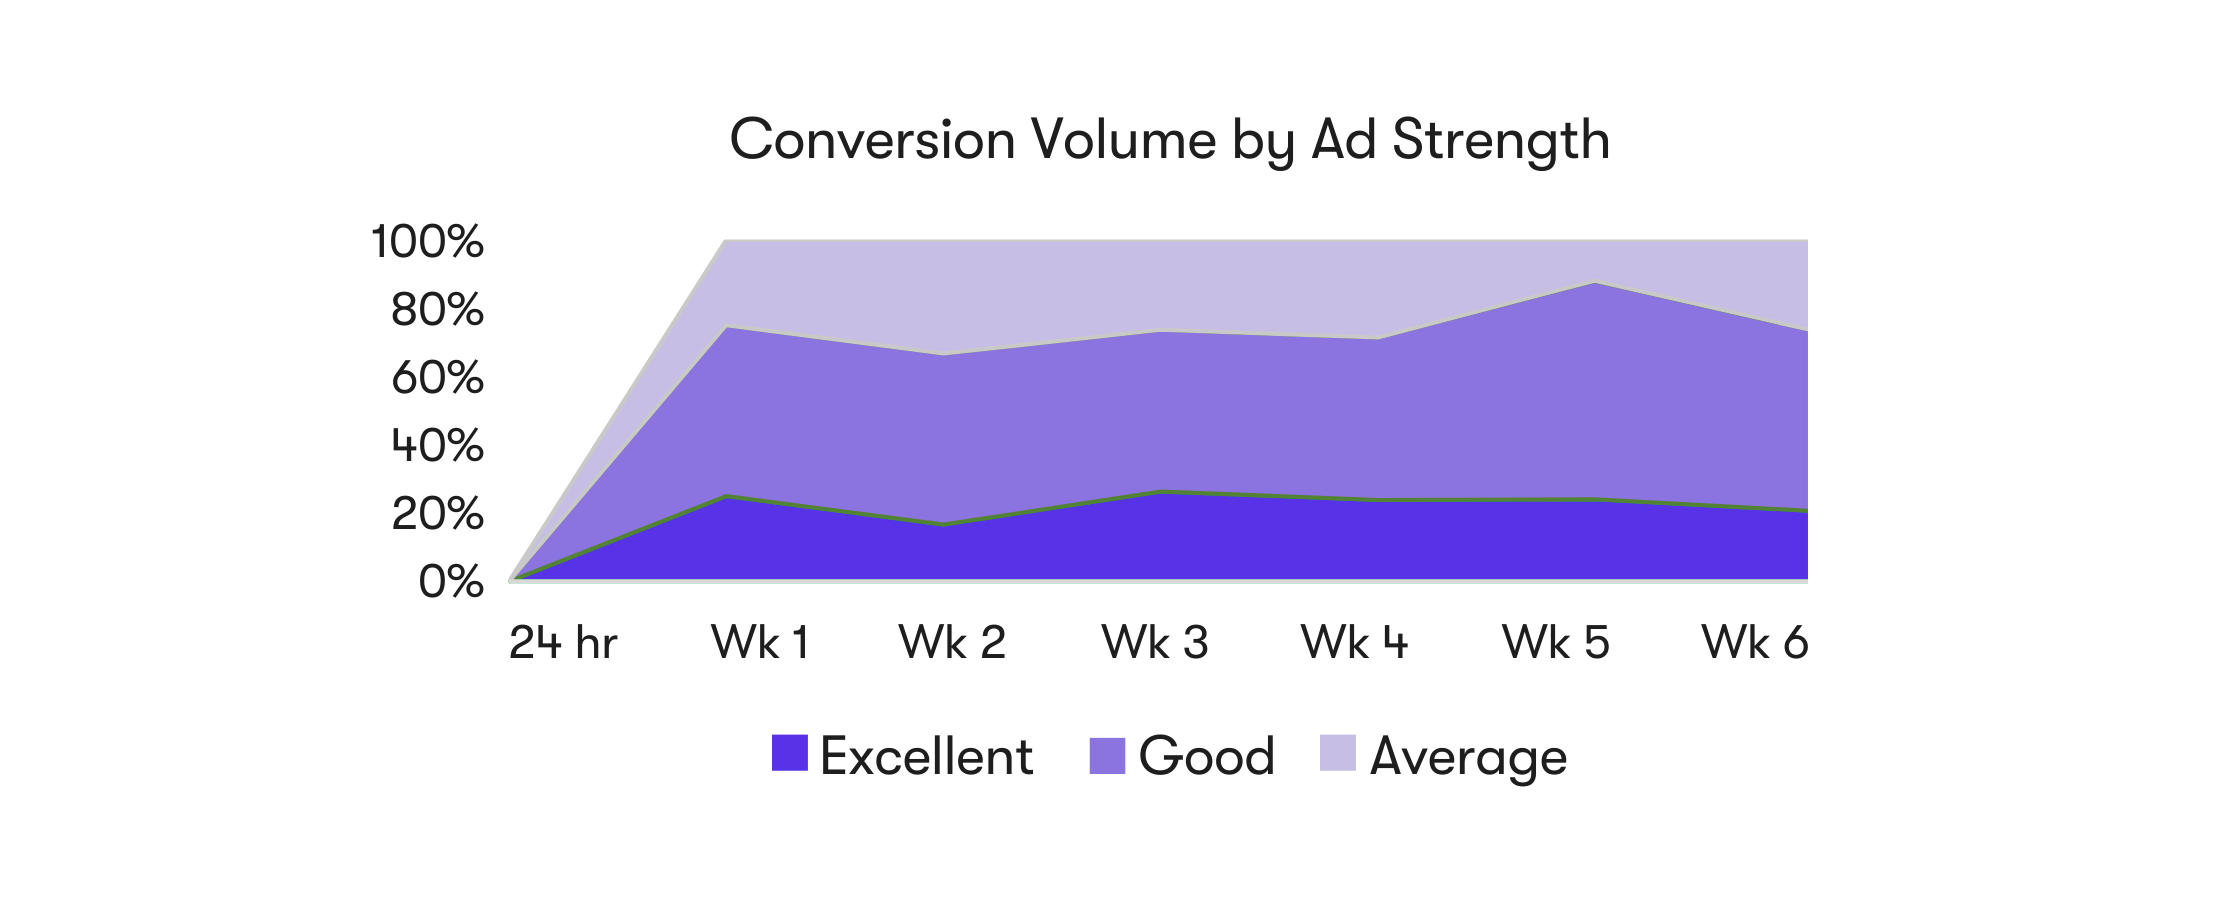
Ad strength distribution was a lot more even when it came to conversions.
So did the update in ad strength improve performance?
Although improving ad strength to act on account recommendations was one of the goals, every effort in B2B paid media and ultimately in SEM is easier to understand if we base our conclusions on performance. We want to understand whether the ad strength upgrade generates more affordable CPA at scale and answer if the amount of time we put into ad strength improvement is ROI positive. The answer is yes to both.
Bookmark this page for future (6 and 12 months) updates.
If you’re looking to optimize your ad strength, drop us a line and our team of Search Experts will customize a strategy that meets your needs.

Just Global Social Media Supervisor, Samantha Kretmar, shares advice on navigating Twitter’s evolving landscape.

Just Global Sr. Strategic Solutions Director, Marcus Hiles, shares five takeaways after attending the 2022 Gartner Symposium in Barcelona.

Just Global Copywriter, Callum Macdonald, shares his three biggest takeaways after attending B2B Marketing’s Ignite London 2022.